McCabe Thiele Diagram
This article shows how to draw McCabe Thiele diagram for doing binary distillation analysis in a spreadsheet.
Example
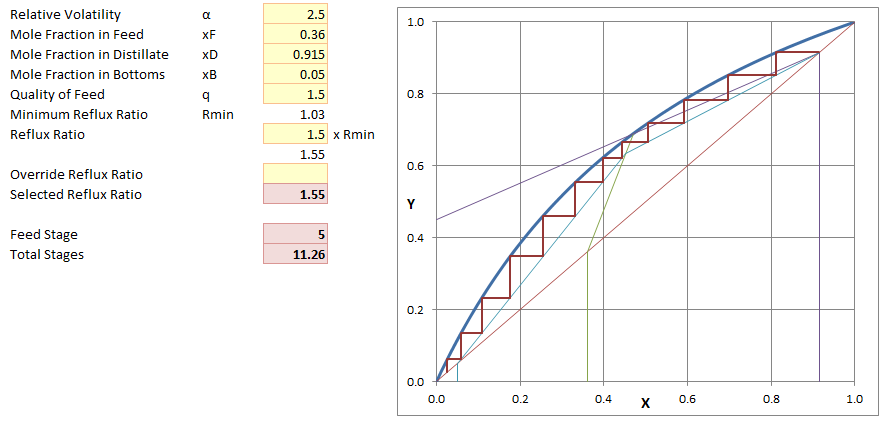
Determine total number of stages and feed stage for separation of a binary mixture with relative volatility (α) 2.5, Feed composition (zF) 0.36, Distillate Composition (xD) 0.915, Bottom composition (xB) 0.05 and feed quality (q) 1.5. Reflux ratio to be 1.5 times the minimum reflux ratio (Rm).
Minimum Reflux Ratio (Rm)
Calculate the intersection of q-Line and equilibrium curve.
y = qx /(q-1) - zF /(q-1)y = αx / (1+ x (α - 1))
Solving above equations gives a quadratic expression, which is solved for positive roots.
x² (q(α-1)) + x (q - zF (α -1) - α(q-1)) - zF = 0x1 = 0.470y1 = 0.689
Draw a line from ( xD, yD) passing through ( x1, y1) with an intercept xD / (Rm + 1) on Y axis.
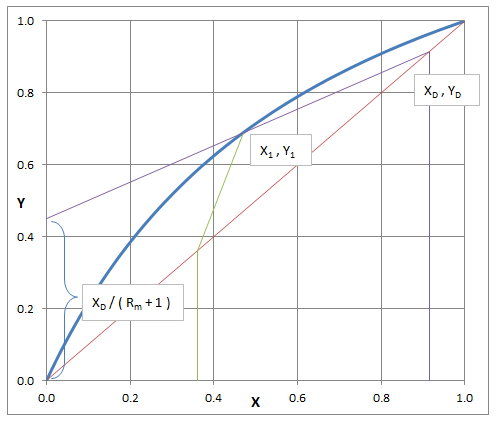
xD / (Rm + 1) = 0.450Rm = 1.032
Reflux ratio is calculated as 1.5 times the minimum reflux ratio.
R = 1.5 x RmR = 1.55
Operating Lines
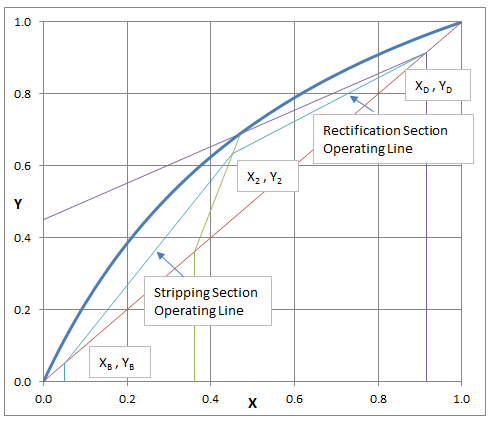
Intersection of q-Line and rectification section operating line is calculated.
y = qx /(q-1) - zF /(q-1)y = Rx /(R+1) + xD /(R+1)x2 = 0.451y2 = 0.633
Draw rectification section operating line from (xD, yD) to (x2, y2) and stripping section operating line from (x2, y2) to (xB, yB).
Draw Stages
Start drawing steps from (xD, yD). Draw a horizontal line by calculating x value from equilibrium curve based on yD. Check whether this x value is greater than x2. As long as it is greater than x2 rectification section operating line is used for calculation of y value. For next step this new value of y is used and rest of the steps are repeated. If x becomes less than x2 stripping section operating line is used for calculation of y value. It is continued till it is greater than xB.
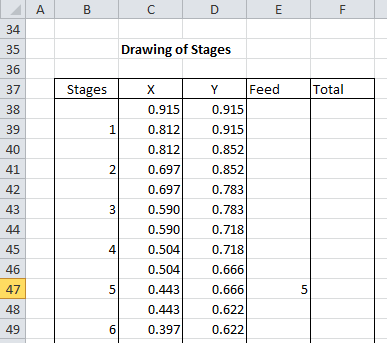
Feed stage is determined by checking at each stage when x value becomes less than x2, similarly total number of stages are determined by checking at each stage when x value become less than xB. At last stage value of x is calculated and difference with xB is added to give total number of stages.
Feed Stage = 5Total Stages = 11.26
Resources
- Spreadsheet for Binary Distillation analysis based on McCabe Thiele method