Binary Vapor Liquid Equilibrium (VLE)
This article shows how to prepare Pxy and Txy diagram for binary mixtures in excel spreadsheet based on Wilson, NRTL and UNIQUAC activity coefficient model.
For low to moderate pressure vapor liquid equilibrium (VLE) is described by modified Raoult's Law -
yi P = xi γi Pisatwhere, yi is vapor mol fraction, P is system pressure, xi is liquid mol fraction, γi is activity coefficient and Pisat is vapor pressure for a pure component i. Vapor pressure is calculated based on Antoine equation.
ln Pisat = Ai - Bi /( T + Ci )Ai , Bi and Ci are Antoine equation constants and T is temperature at which vapor pressure is to be calculated.
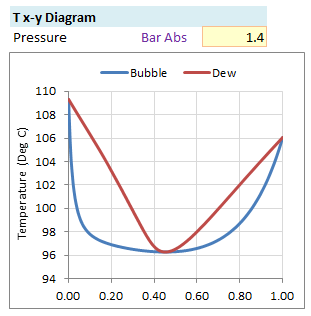
Txy Diagram
Txy diagram plots bubble and dew point curves at constant pressure P. Put down the liquid mol fraction x1 from 0.0 to 1.0 with increment of 0.01 in spreadsheet. Iteration is done for each liquid mol fraction to estimate equilibrium temperature T and activity coefficient γi.
For first iteration, T1sat and T2sat are calculated from Antoine equation.
Tisat = Bi/ (Ai - ln Pisat) - CiEquilibrium temperature is estimated as following -
T = x1 T1sat + (1 - x1)T2sat Based on temperature T, activity coefficient γ1 and γ2 are calculated from activity coefficient model selected e.g. Wilson, NRTL and UNIQUAC. For ideal mixture γ1 and γ2 are 1.
Saturation pressure for a component is calculated using following equation -
P1sat = P/(x1γ1 +(1-x1)γ2 P2sat/P1sat)Temperature corresponding to the vapor pressure P1sat is calculated from Antoine equation.
T = B1/ (A1 - ln P1sat) - C1Temperatue thus calculated is used for next iteration and activity coefficients γ1 and γ2 are calculated. Iterations are repeated till there is no change in subsequent temperature estimations. Typically temperature difference becomes negligible within 10 iterations.
Above steps are repeated for all liquid mol fractions, thereby giving a table of x1 and corresponding temperature T. Vapor mol fraction y1 is calculated as following -
y1 = x1 γ1 P1sat/ PPlot of T, x1 & y1 gives Txy Diagram -
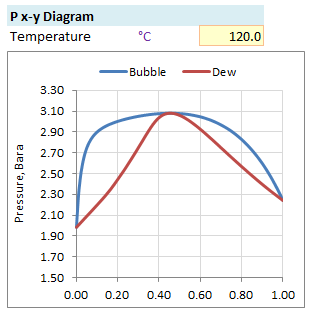
Pxy Diagram
Pxy diagram plots bubble and dew point curves at constant temperature T. Put down the liquid mol fraction x1 from 0.0 to 1.0 with increment of 0.01 in spreadsheet. Calculate activity coefficients γ1 and γ2 based on activity coefficient model selected from Wilson, NRTL and UNIQUAC.
Calculate partial pressure of each component P1 and P2 as following -
P1 = x1 γ1 P1satP2 = (1 - x1) γ2 P2sat
Equilibrium pressure is obtained as following -
P = P1 + P2Vapor mol fraction is calculated as per below equation.
y1 = P1 / PPlot of P, x1 & y1 gives Pxy Diagram -
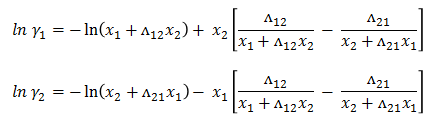
Wilson Model
Activity coefficient for binary system are defined as -
Wilson parameter is provided by following equation -
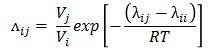
where, λ12 - λ11 and λ21 - λ22 are binary interaction parameters available from literature for a binary pair.
Modified Rackett equation is used to estimate liquid molar volume V1 & V2.
V = (RTc/Pc)ZRA [1 + (1-Tr)^(2/7)]where, Tc and Pc are critical temperature and pressure. Tr is the reduced temperature. ZRA is Rackett equation parameter, if it is not available, it can be estimated from accentric factor ω as following.
ZRA = 0.29056 - 0.08775ωNRTL Model
Activity coefficient for binary system are defined as -
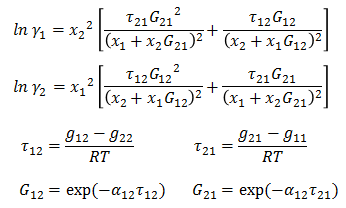
Parameter g12 - g22 and g21 - g11 are binary parameters available from literature. α12 is related to non-randomness in mixture and is available from literature for binary pairs.
UNIQUAC Model
Activity coefficient for binary system are defined as -
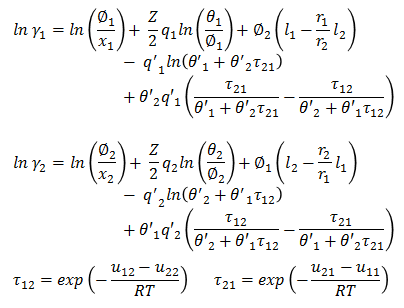
Parameter u12 - u22 and u21 - u11 are binary parameters available from literature. Remaining parameters are calculated as following -
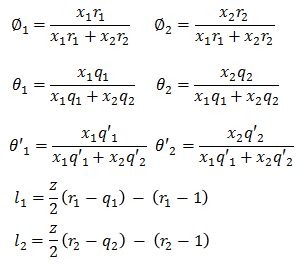
where z is set equal to 10 and r, q & q' are pure component UNIQUAC parameters.
Resources
- Spreadsheet for Binary Vapor Liquid Equilibrium